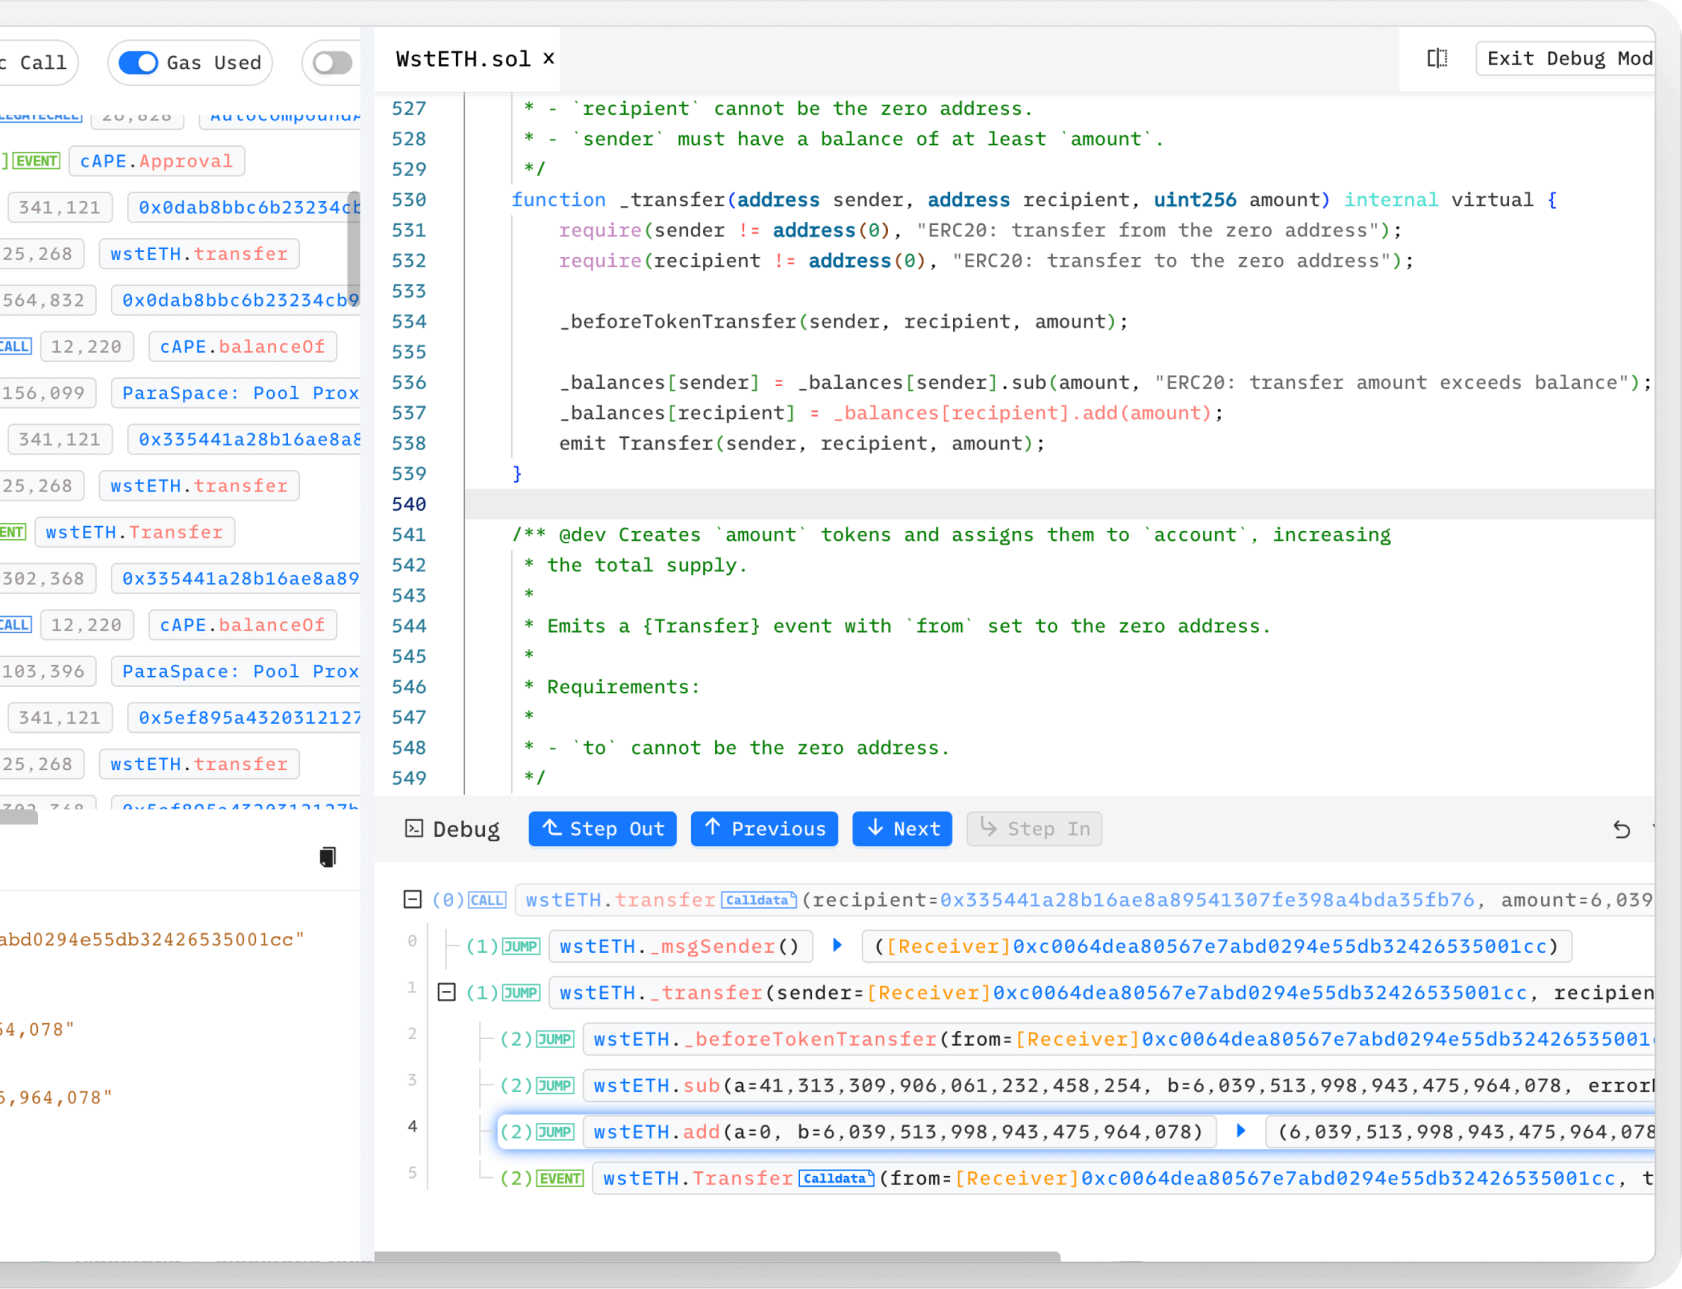
Online Transaction Debugging
Transaction debugging enhances efficiency when analyzing complicated transactions. With the source code view and debug console, users can navigate through both internal and external function calls, accessing detailed parameters and return values. For those with dual displays, the debug view in a separate tab streamlines the debugging experience.
Use Cases

Developers
Debugging Contracts and Transactions on Testnets
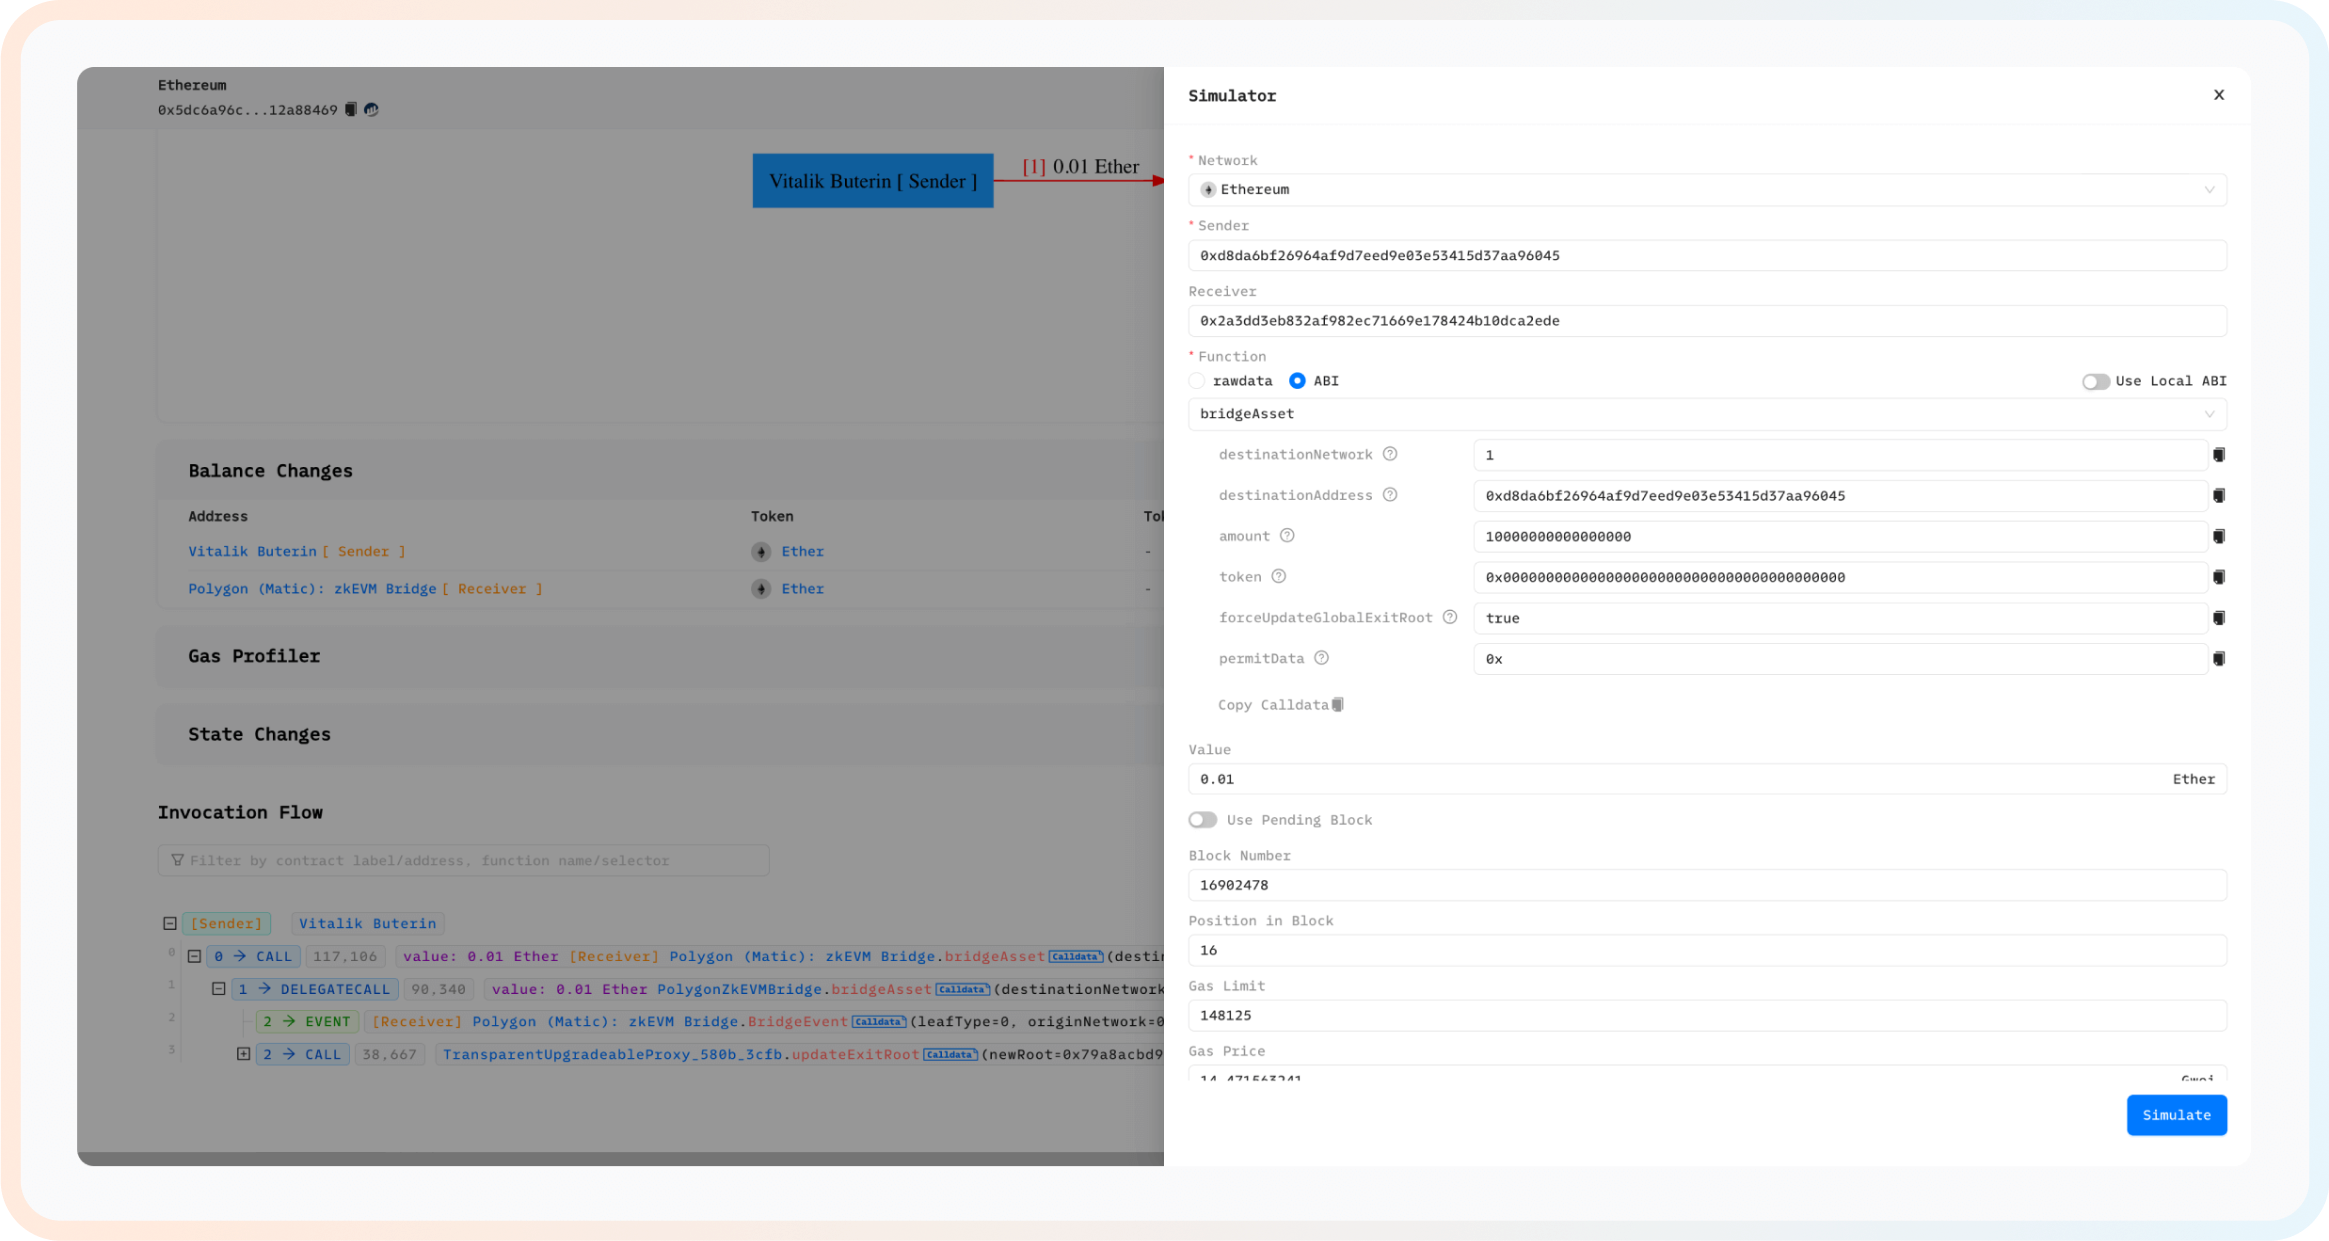
Phalcon Explorer supports Ethereum testnets. Developers can deploy contracts on testnets or forks before launching on the mainnet. During this phase, Phalcon Explorer helps developers in swiftly debugging contracts and transactions.

High-frequency Traders
Analyzing Trading Strategies
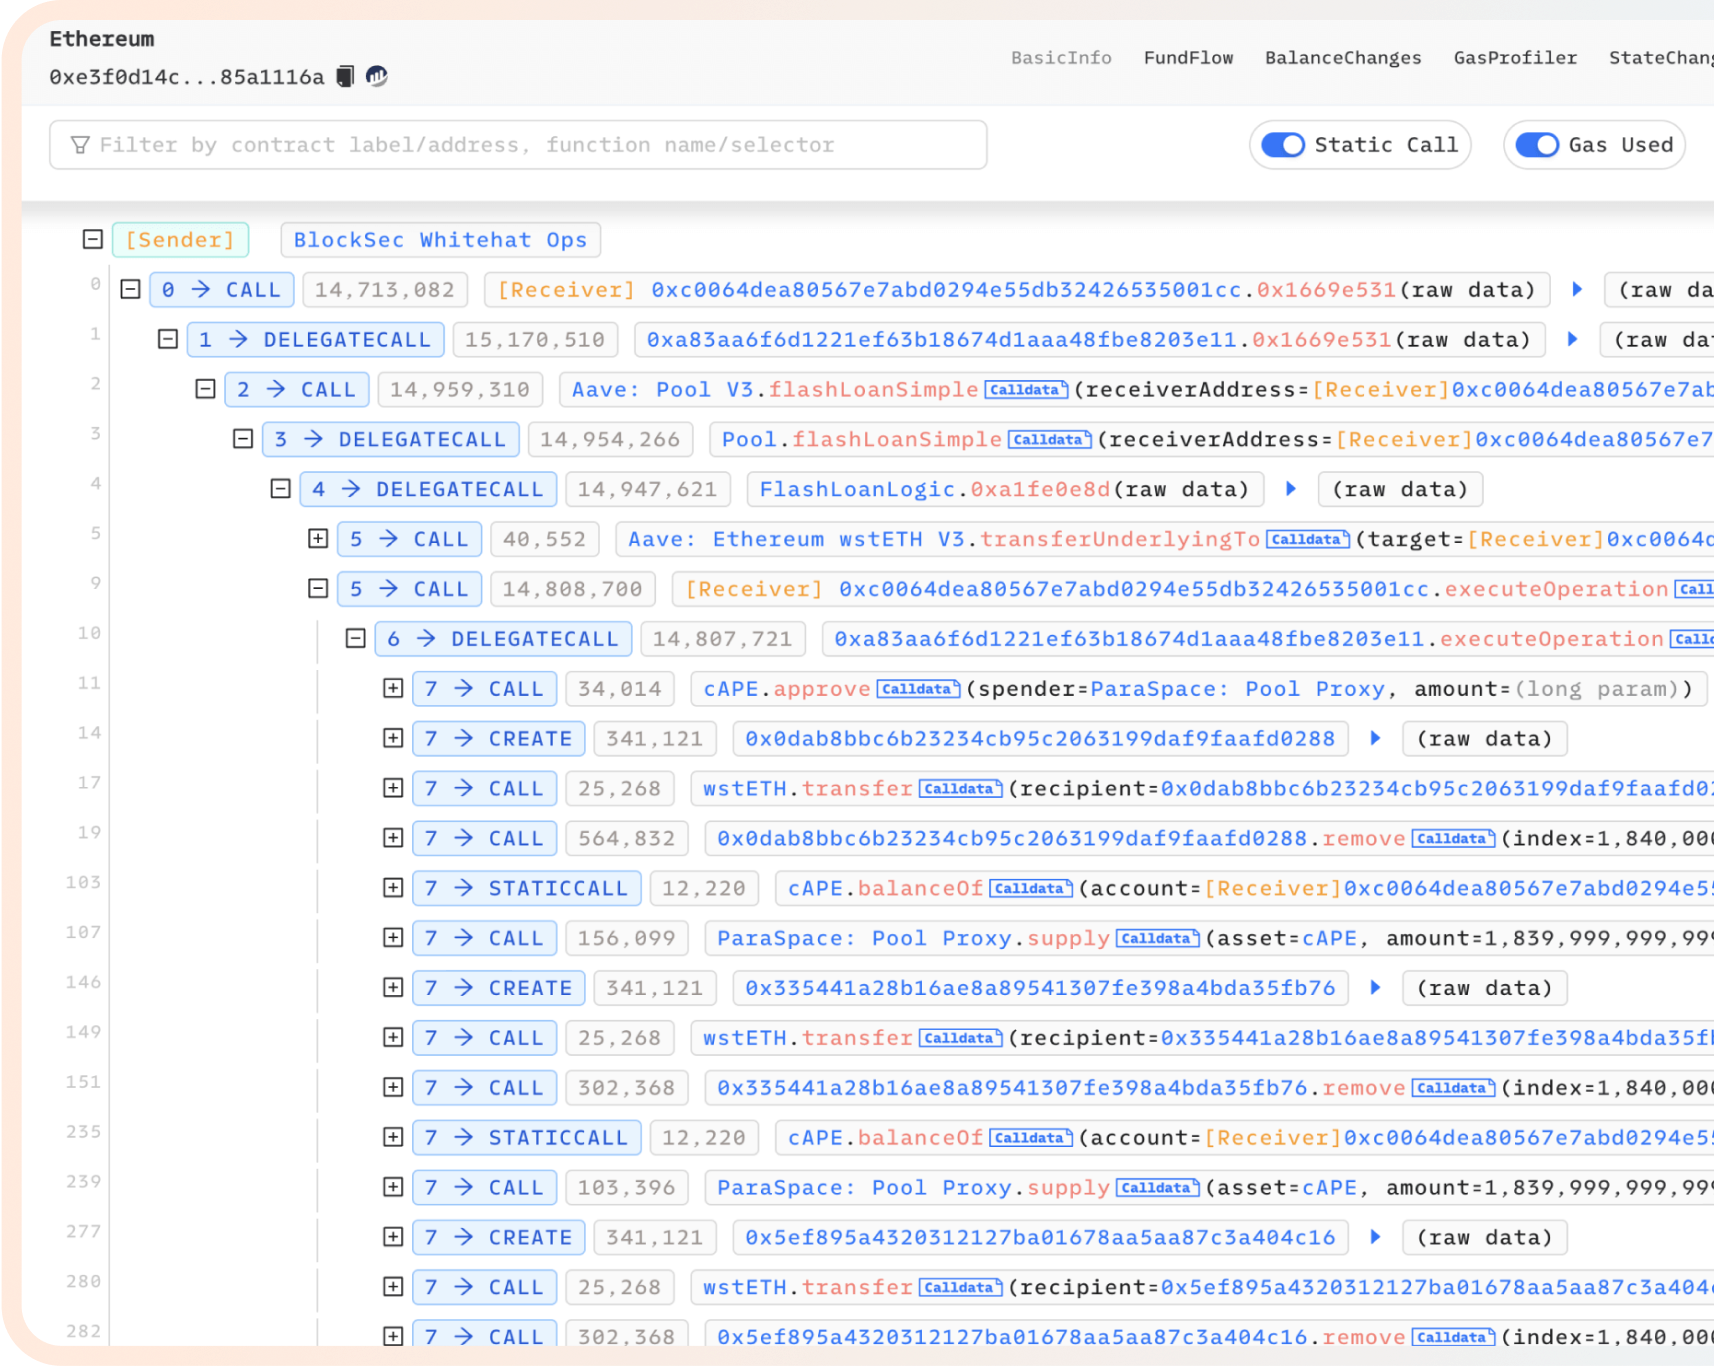
Phalcon Explorer rapidly analyzes the profitability of other transactions, providing insights into execution processes and gas consumption. This feature assists traders in optimizing their arbitrage strategies for increased profits.

Security Researchers
Analyzing On-chain Security Incidents
Phalcon Explorer offers extensive features, including balance changes, state changes, call traces, and debugging. It can facilitate the analysis of attack transactions to pinpoint the root causes of attacks.